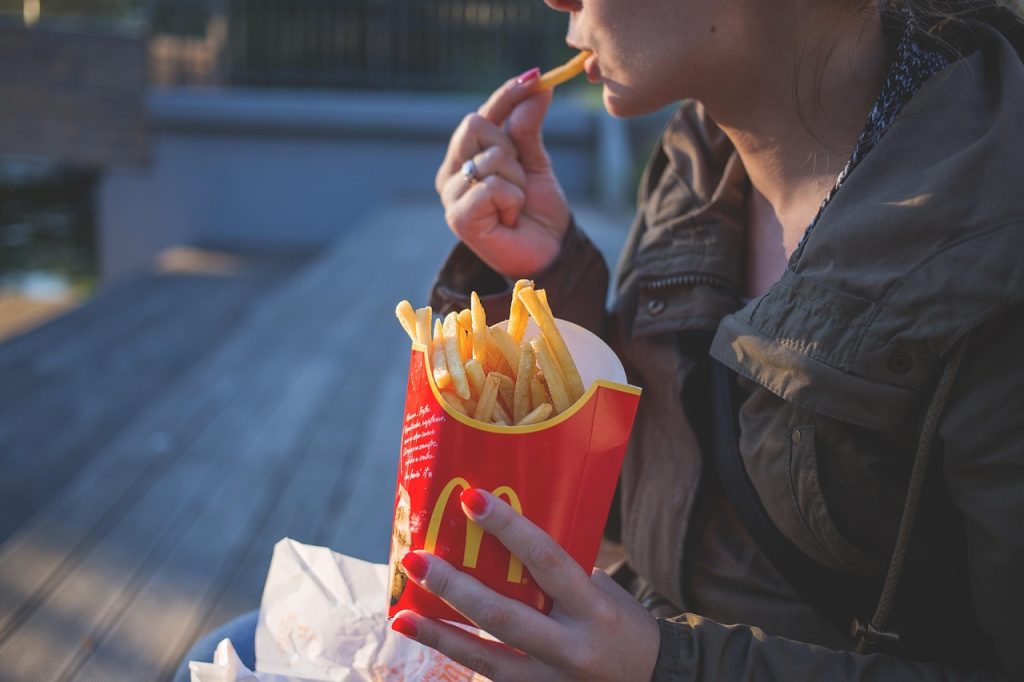
UNDATED – With fast food prices rising by an average of 47% over the past decade, the personal-finance website WalletHub today released its report on the States Where People Spend the Most & Least on Fast Food to shed light on where these purchases put the biggest strain on Americans’ wallets.
To determine where consumers spend the most and least relative to their earnings, WalletHub analyzed the average prices of burgers, pizza and fried chicken sandwiches in each of 50 states, then compared them to the median household income.
South Dakota ranked 26th in the study.
| Highest % of Income Spent | Lowest % of Income Spent | |
| 1. Mississippi (0.4740%) | 41. Washington (0.3279%) | |
| 2. New Mexico (0.4682%) | 42. Colorado (0.3197%) | |
| 3. Kentucky (0.4585%) | 43. Virginia (0.3144%) | |
| 4. Arkansas (0.4533%) | 44. Maryland (0.3121%) | |
| 5. West Virginia (0.4412%) | 45. Minnesota (0.3098%) | |
| 6. Louisiana (0.4384%) | 46. New Hampshire (0.3028%) | |
| 7. Alabama (0.4316%) | 47. Utah (0.3024%) | |
| 8. Montana (0.4297%) | 48. Connecticut (0.2997%) | |
| 9. Oklahoma (0.4226%) | 49. New Jersey (0.2948%) | |
| 10. Vermont (0.4209%) | 50. Massachusetts (0.2896%) | |
To view the full report and your state’s rank, please visit:
https://wallethub.com/edu/states-where-people-spend-the-most-least-on-fast-food/146260


